
Some inventions haven’t changed much since they first came about…even if centuries have passed. For instance, the pop-up toaster was invented in 1921, and although enhancements have been made, it still toasts bread. Paperclips hit the market about 150 years ago and they still hold sheets of paper together. The same is true of the lead-acid battery, a device that was invented in 1859 and operated under the same basic principles as the one currently in your car.
A Powerful, Affordable, and Rechargeable Battery
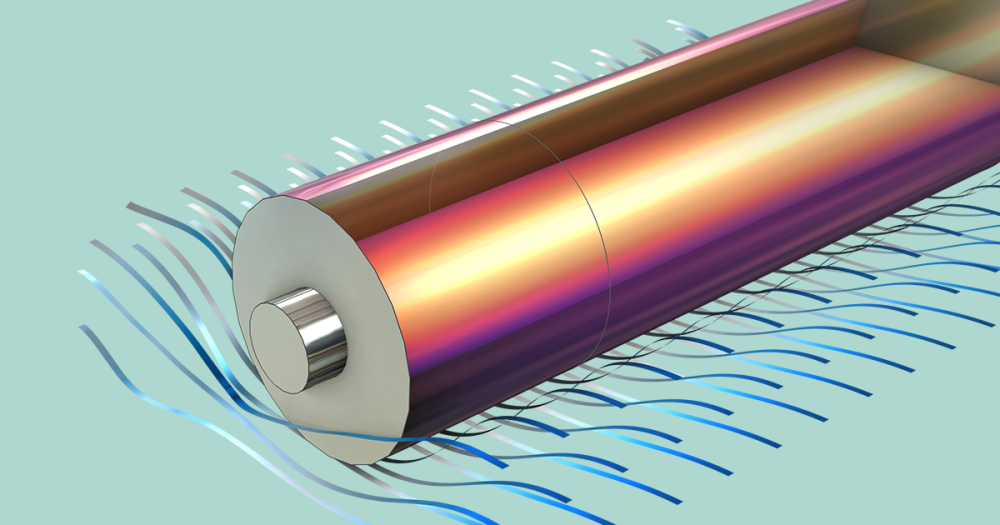
Gaston Planté was a French physicist who is best known for developing the lead-acid battery in 1859. Planté’s first iteration of the battery was made up of two sheets of lead that were rolled into a spiral and separated by a piece of linen. The lead was then submerged in a solution of sulfuric acid. Although bulky and heavy in design, these batteries were powerful. One of their first uses was to power train cars when they stopped at stations so that the lights would remain on for passengers.
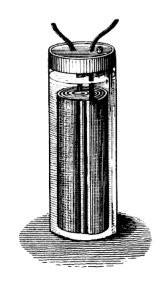
An illustration of Gaston Planté’s lead-acid battery. Image in the public domain in the United States, via Wikimedia Commons.
Today, the basic operating principle of lead-acid batteries has not changed. They are desirable for applications in the automotive and power industries because of their large power-to-weight ratio and low cost as well as their ability to be rechargeable via the use of a reverse current.
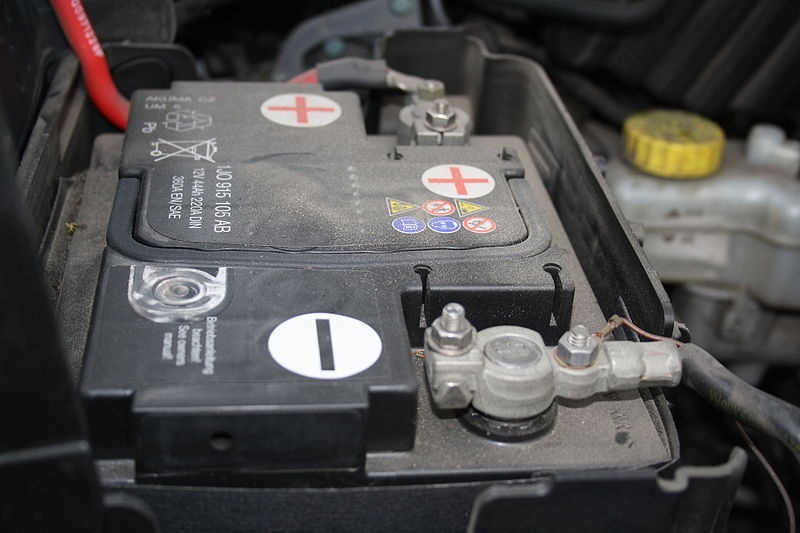
A lead-acid battery in an automobile. Image by Frettie — Own work. Licensed under CC BY 3.0, via Wikimedia Commons.
Although the basic way a lead-acid battery works hasn’t changed since the days of Planté, they can still be analyzed and improved for modern-day applications. Optimizing the design of a lead-acid battery grid, for example, can improve its performance and operational lifetime as well as decrease its weight. One way to do so is through electrochemical modeling.
Modeling a Lead-Acid Battery with the COMSOL® Software
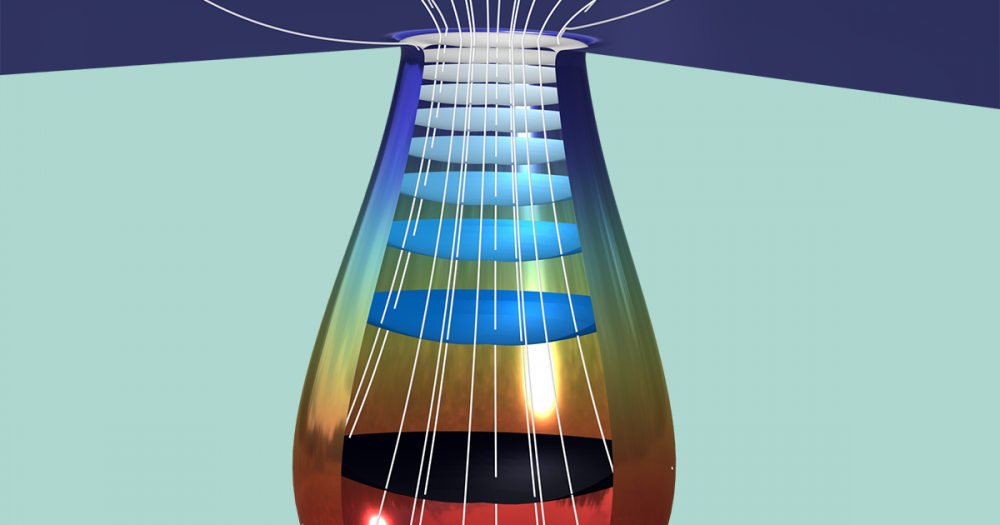
Using the COMSOL Multiphysics® software along with the add-on Battery Design Module, you can set up a geometry of a lead-acid battery model for analysis. The battery example discussed here is a half-cell consisting of a grid, lug, and matrix of porous electrodes surrounded by an electrolyte domain. The simulation evaluates the battery’s performance under a high load discharge of 100 A.
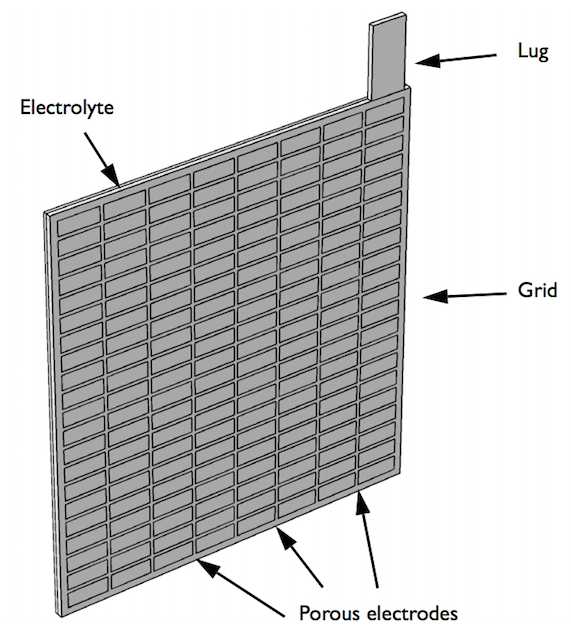
Geometry of the half-cell model.
The Primary Current Distribution interface is a set of predefined modeling features within the Battery Design Module that is used to model the current distribution in the half-cell. When modeling using the Primary Current Distribution interface, the factors controlling the cell behavior are:
- Conductivity of the electrolyte and electrodes
- Current density
- Cell geometry
Contributions from mass transport and electrode kinetics are neglected. This interface is thus a good choice for modeling cells where the electrolyte concentration is large enough not to change significantly over time (at the chosen current density) and the contribution from charge transfer resistance is minor in comparison with the contribution from electrolyte resistance. When using the Primary Current Distribution interface for a specific set of cell materials and a specific chemistry, the cell geometry alone determines the potential field. In addition, the physics behind this interface don’t involve nonlinear expressions, which means it is easy to solve and can be used to find an approximation before setting up a more complex battery model.
The Primary Current Distribution interface defines two dependent variables:
- Electric potential in the electrolyte, which here is set to zero at the external boundary parallel to the battery grid
- Electric potential in the electrodes, which is found by using the Internal Electrode Surface node to set the primary current condition
Evaluating the Electric Potential and Current Distribution in the Battery
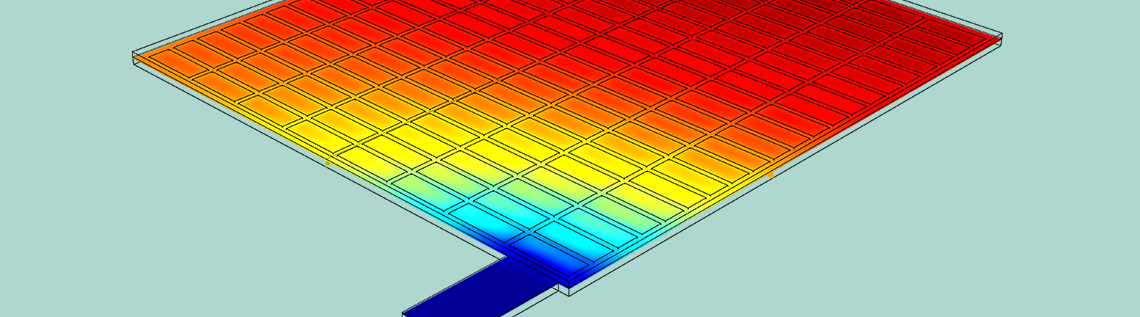
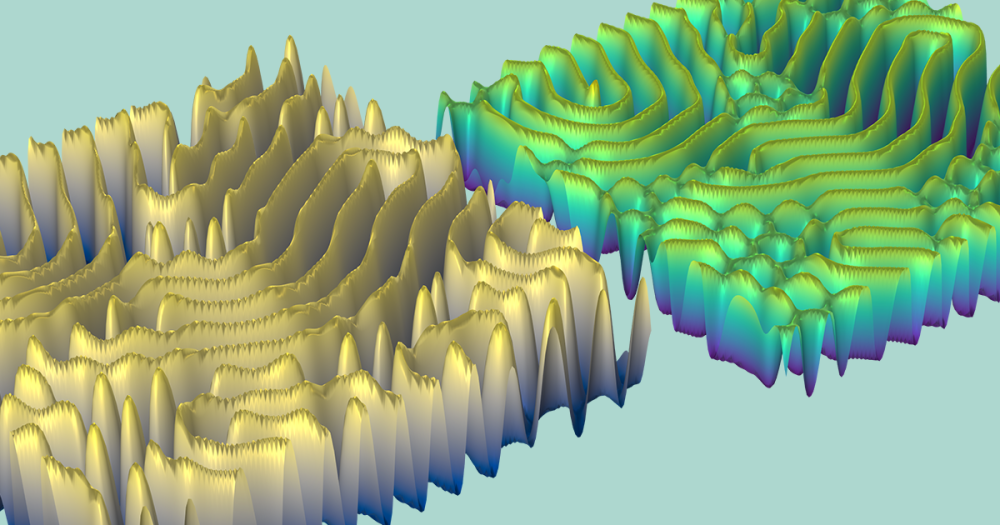
The results of the analysis show the potential and current density for a lead-acid battery of a specific design and operating conditions. The potential in the electrolyte and porous electrode are plotted to show that the potential drop is highest in the area in the cell closest to the lug. Plotting the potential in the grid and lug gives the potential difference (0.15 V) between this area around the lug and the far corner.


The electric potential in the electrolyte and porous electrode (left) and in the grid and lug (right).
The results also show the current density distribution. For this design, the current density is two times as high in the most active region of the cell (closest to the lug) when compared to the opposite corner of the cell.
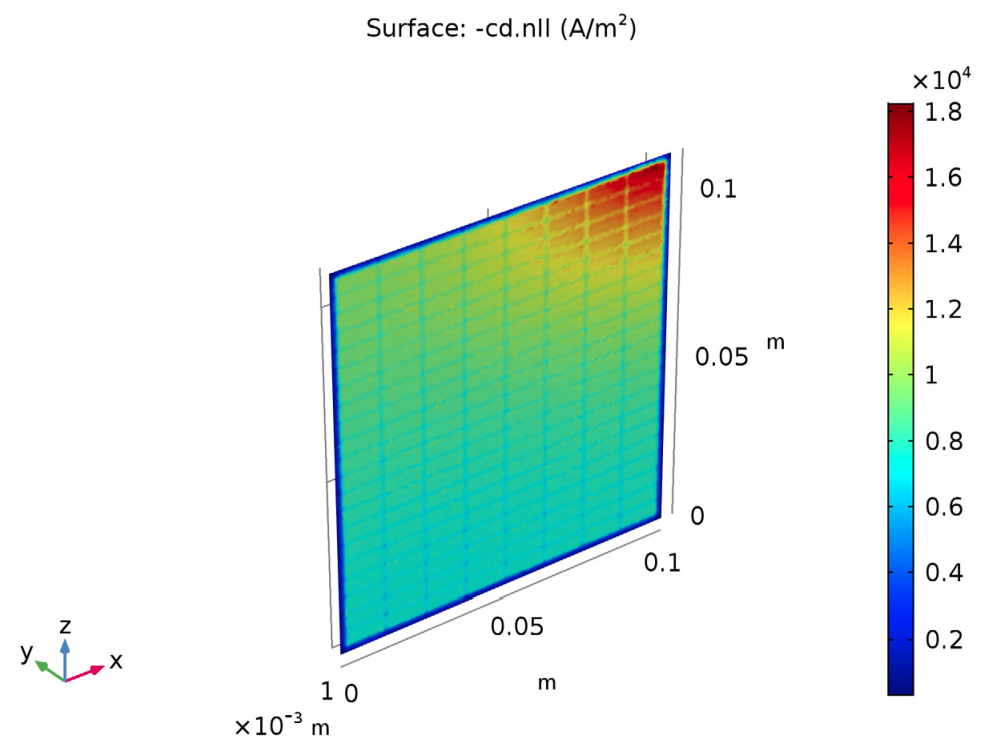
The current density distribution in the lead-acid battery model.
What do these results have to do with improving the battery’s performance? The values for the potential and current density distribution suggest that by making the frame of the grid thicker in the area around the lug corner, the current distribution will even out and become more uniform in the rest of the cell. A uniform current distribution in a lead-acid battery leads to improved performance and reliability.
Next Steps
Try the Primary Current Distribution in a Lead-Acid Battery Grid Electrode model yourself. Clicking on the button below will take you to the Application Gallery and the MPH-file download.

Comments (0)